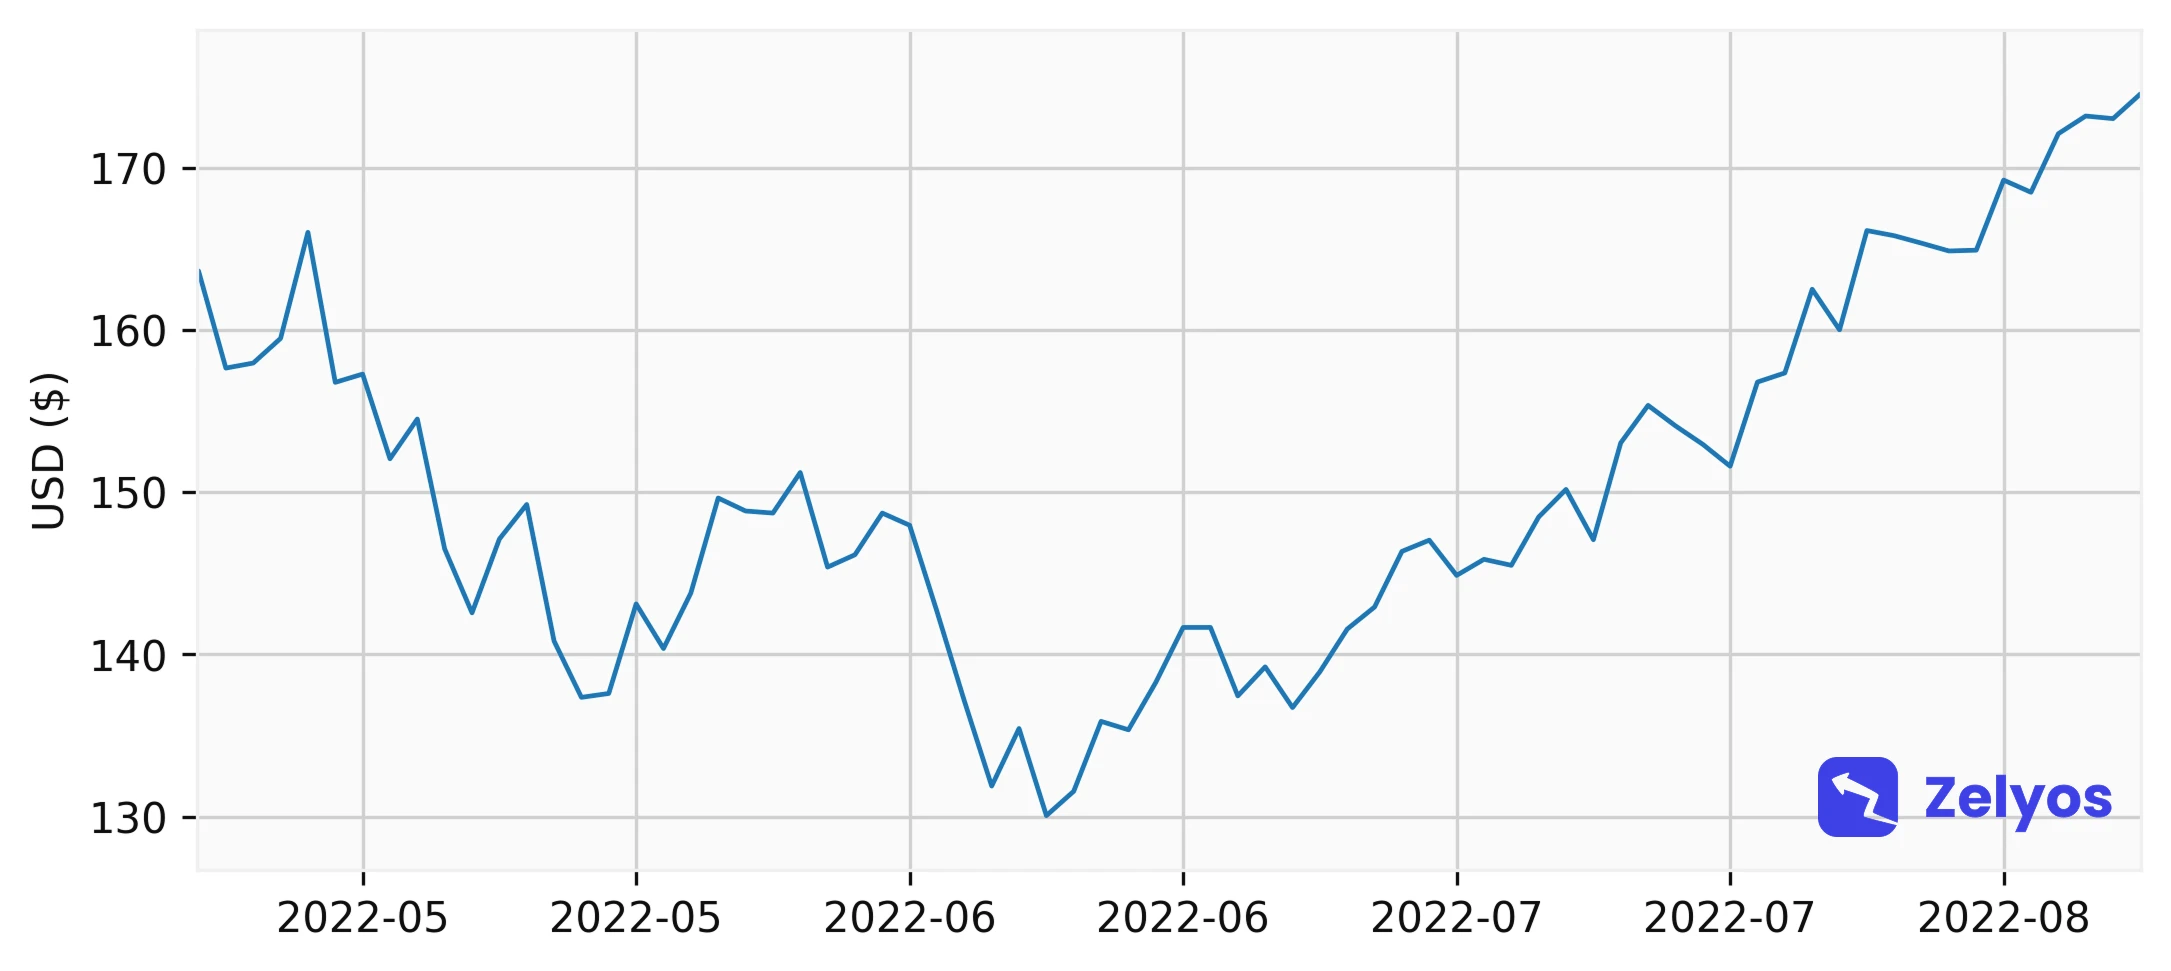
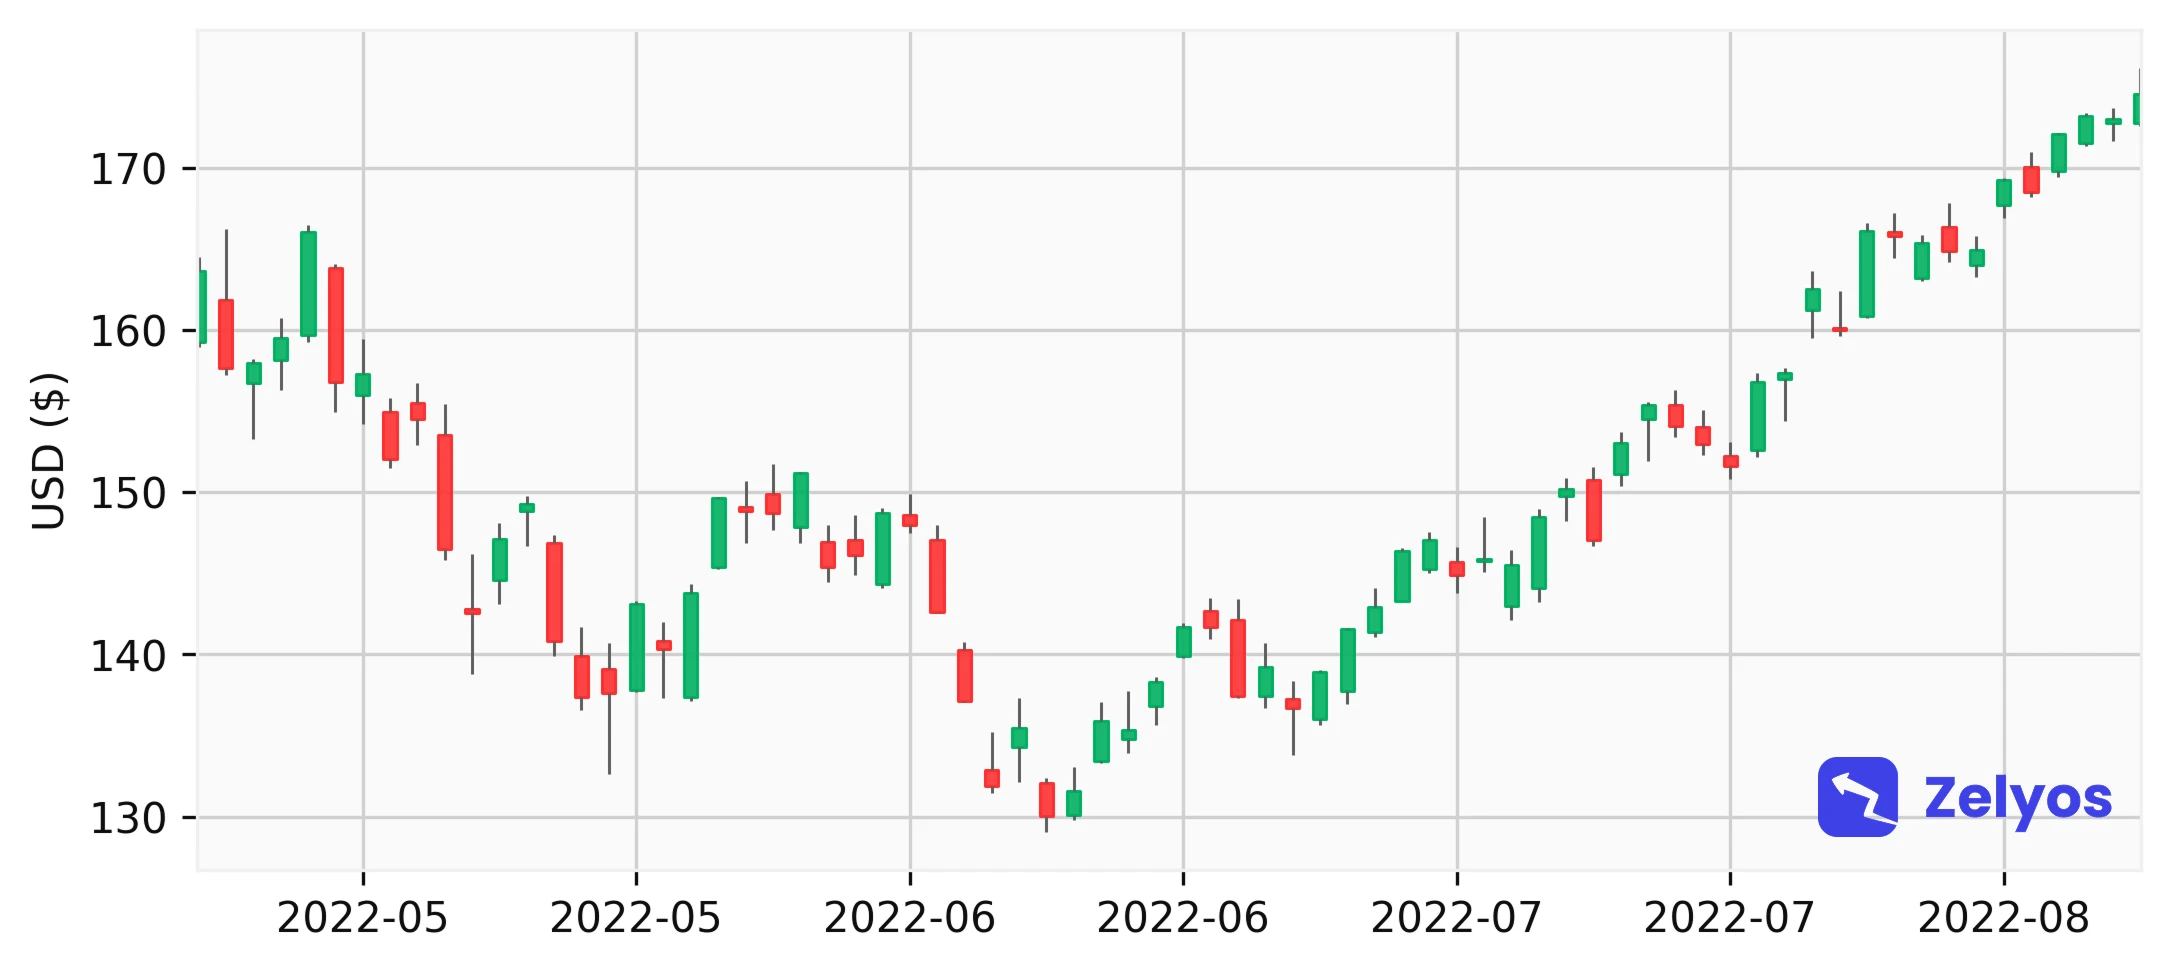
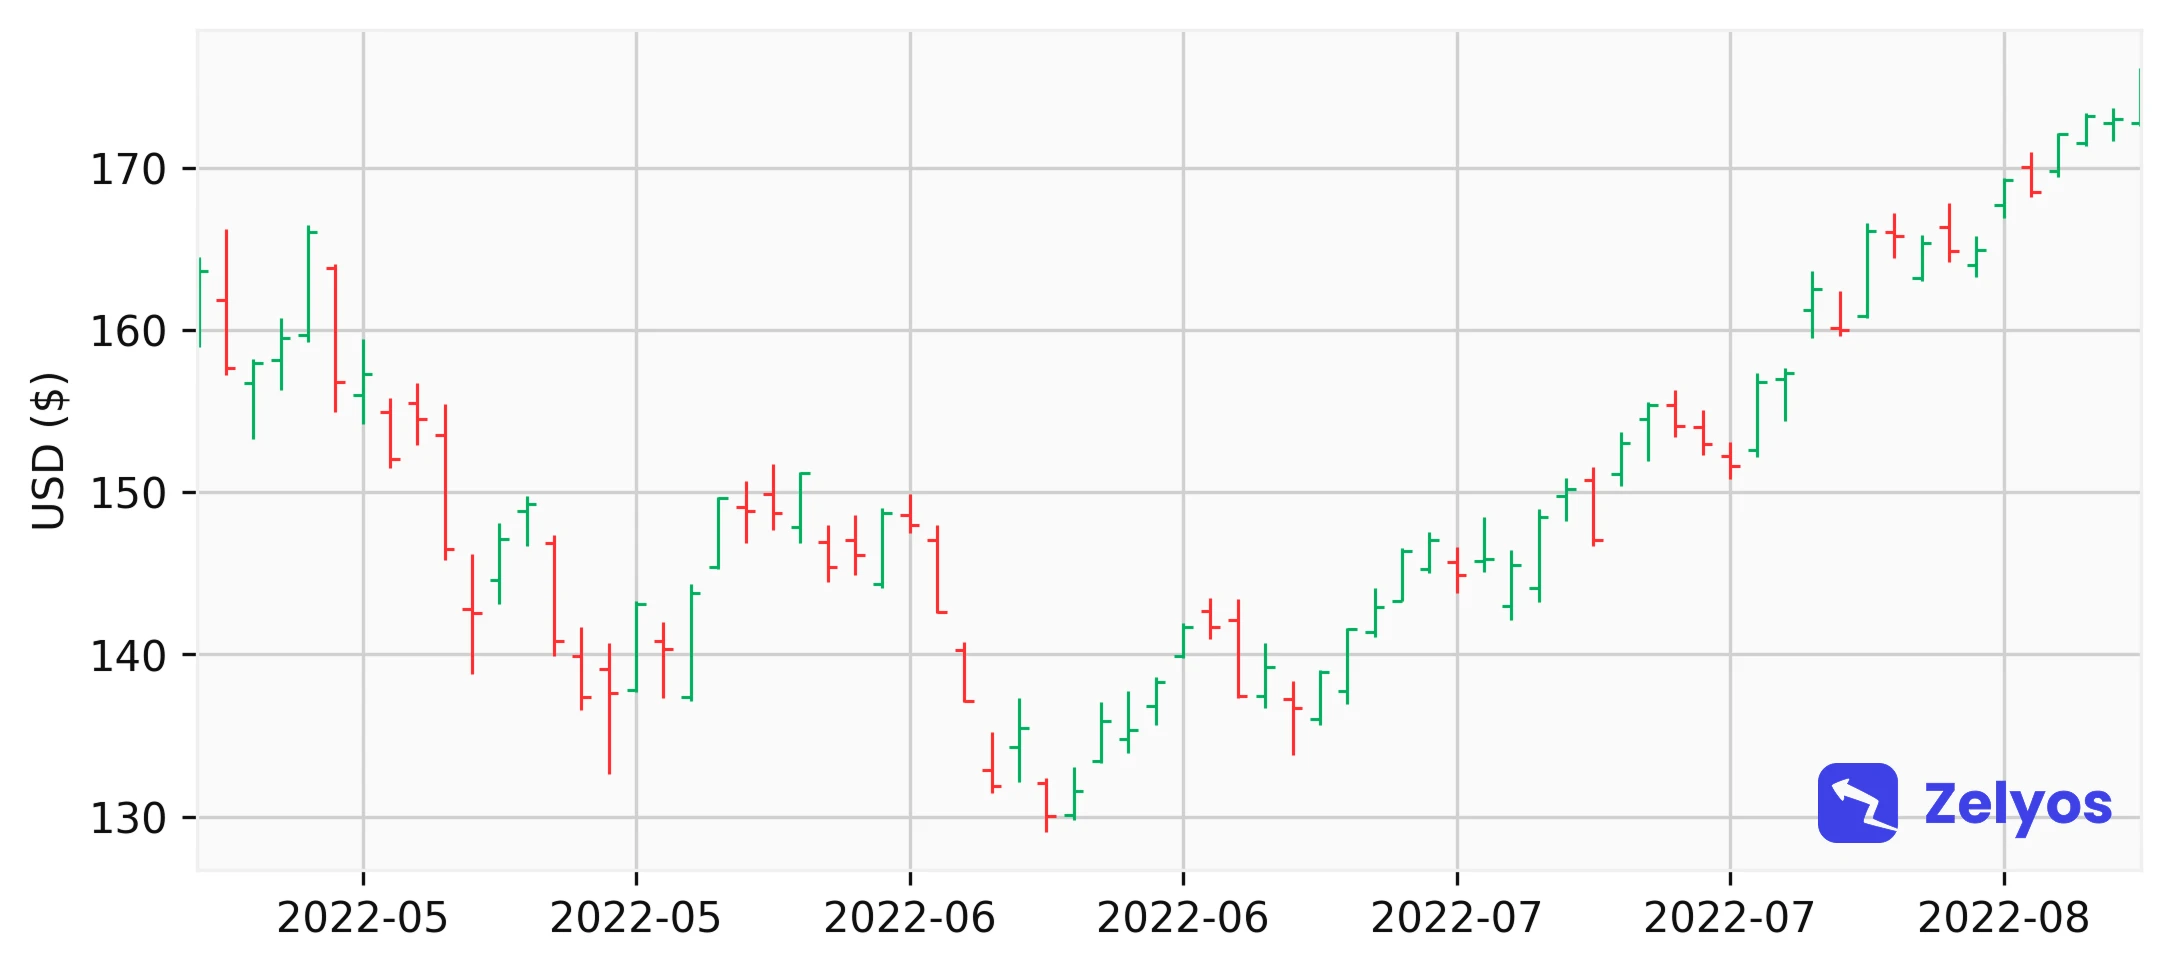
The 3 key technical indicators for starting (RSI, SMA, MACD)
Understanding technical indicators on the stock exchange
Technical indicators are among the essential tools investors need to know if they want to better understand financial market movements and are part of the price and volume history analysis that will help decode market psychology and serve as a basis for defining future trends. By adopting these instruments, you can not only refine your investment strategies but also hope to improve your returns.
It is crucial, as a beginner or intermediate investor, to become familiar with these technical indicators if you want to make wise choices during your investments. Among them, the RSI (also known as the Relative Strength Index) is used to evaluate price dynamics, which will allow the detection of over-purchase or over-sale conditions. What is called the RSI formula is based on a scale of 0 to 100, where an RSI greater than 70 can indicate over-purchase and less than 30 an oversold.
Once this concept is understood, we will have to address the Simple Moving Average (SMA) which is a fundamental tool for smoothing price data. It will be useful to clarify market cycles and trends over defined periods. And finally, the MACD (Moving Average Convergence Divergences) allows investors to identify signals of trend change.
 Indicators (such as RSI, SMA, MACD, ...)
RSI on the stock exchange: The key to reading the momentum
The RSI, or "Relative Strength Index", is one of the indispensables for anyone interested in technical analysis on the stock exchange. Designed by J. Welles Wilder Jr. In 1978, the RSI is an oscillator that evaluates the speed and magnitude of price movements over a specified period of time, usually 14 days. To put it simply, it quantifies the momentum, i.e. the underlying force that animates the fluctuations in stock prices. The RSI is measured on a scale of 0 to 100. Its key levels are often defined at 30 and 70, representing over-sales and over-purchase conditions respectively.
In the current context of the global market, where uncertainty can cause values to swing quickly, understanding the meaning of the RSI for shares becomes a major asset. For example, an RSI greater than 70 may indicate a downward potential, suggesting that the security could be overvalued in the short term. Conversely, an RSI of less than 30 could indicate an opportunity to purchase, suggesting that the security is undervalued.
If you want to go further, you can explore concepts such as the RSI Smart Cap, which adapts RSI strategies for small or medium titles. By integrating RSI with other indicators such as the SMA (Mobile Simple Medium) in your trading strategy, you improve the quality of your decisions.
Quiz: What is the RSI assessment range on the stock market?
- 1 to 50
- 10 to 100
- 0 to 100
- 30 to 70
RSI formula
The RSI (Relative Strength Index), a highly valued technical indicator, is generally based on a period of 14 units (days, weeks, etc.). It is as follows:
 RSI formula
with
 RSI formula part 2
This calculation provides a value between 0 and 100, which can be used in assessing the price dynamics of an asset. In other words, the RSI is an indicator used to identify the conditions of over-purchase and over-sales in the market. If the level of RSI is higher than 70 this may suggest that the asset is potentially over-purchased, which means that its price could soon correct downwards. Conversely, an RSI of less than 30 may mean that the asset is potentially oversold, suggesting a future purchase opportunity.
However, it is useful to add that, like many technical indicators, the RSI should not be used in isolation. It is crucial to integrate it into a broader investment strategy that should take into account other tools such as simple moving average (SMA), fundamental analysis or market sentiment indicators. For example, integrating the RSI on a stock exchange with the Financial SMA for the shares will already provide a more complete view of the overall trend. By having a more comprehensive view, the risk of misinterpretation can be minimized. All these factors are important, especially when it comes to specific niches such as the RSI Smart Cap, where fine market analysis is essential.
Understanding the meaning of the RSI for shares and its formula is of course not enough to guarantee the success of the investment alone. But acquiring a good command of the tools available and applying them wisely will make it easier for you to grasp the right market opportunities.
Common risks and errors
One of the most common pitfalls in the use of the RSI is to consider over-purchase or over-sales thresholds as automatic and infallible purchasing or sales signals. Interpreting RSI values as 30 or 70 in isolation can lead to precipitated investment decisions not to say erroneous. As an example, the RSI case for high-capitalization shares: these securities can maintain a high RSI for extended periods, reflecting a strong and continuous upward trend rather than an imminent reversal of the market.
As everywhere, a reduced vision increases the risk of error and in this case, the lack of consideration of the overall market context may lead to misinterpretations. For a more reliable analysis, it is strongly advised to associate the RSI formula with other technical indicators such as the MACD (Moving Average Convergence Divergence) or Bollinger bands. This multifactorial approach will help you gain a more complete view of market trends and avoid errors that may prove costly.
Quiz: What is one of the common pitfalls of using the RSI stock market indicator?
- Considering the RSI as an indicator of volatility
- Using the RSI only for small-cap stocks
- Considering overbought or oversold thresholds as automatic and infallible buy or sell signals
- Never using the RSI with other technical indicators
SMA (Simple Moving Average) in the financial world
To complement the use of the RSI, the Simple Moving Average (SMA) is another fundamental indicator in the world of market technical analysis. In essence, the SMA helps smooth the sometimes erratic price fluctuations of an asset, thus providing a clearer view of the underlying trends. In other words, as for any average, this tool aims to understand the behaviour of an asset without being distracted by daily movements. For example, a 50-day SMA calculates the average closing price over the last 50 days of the stock exchange. It offers an overview that sets aside the daily hazards.
To what extent is this important to you as an investor? Share prices are influenced by daily events and changing feelings especially in an unstable geopolitical context as it is at this time, the SMA offers a global perspective that reveals trends. Common SMA models, such as those calculated over 50, 100 or 200 days, are widely used to identify potential points of purchase or sale. For example, when an action is negotiated over its 200-day SMA, it is often seen as an uptrend, an encouraging sign for those who engage in long positions.
In addition, the crossing of simple moving averages with different time horizons, such as the 50-day SMA cutting upwards or downwards the SMA at 200 days, can be used as a purchase or sales signal known as the "Golden Cross" or "Death Cross", respectively. These technical indicators, although simplistic, have resisted the test of time because of their efficiency in exposing a changing market dynamics. Sometimes it is not necessary to do complicated to be effective.
To the same extent as for the RSI, like any technical tool, the SMA should be used in conjunction with other analyses to confirm trends and obtain an overall view of the situation.
Quiz: What is the main use of SMA in technical stock market analysis?
- Smooth out price fluctuations for a clear view of trends
- Predict a company's future profits
- Identify economically profitable sectors
- Estimate the implied volatility of options
Use and errors to avoid
As an investor, it is crucial to know how to adjust the simple moving average (SMA) periods to match your investment strategy effectively. A common mistake among beginners is not to adapt the SMA to their specific objectives. In general, a 200-day SMA is widely used for long-term strategies as it offers a perspective on major historical trends. But it is less relevant in other cases, if your strategy is short-term, 20- or 50-day SMA can be more responsive, as they respond more quickly to impending market fluctuations.
Do not confuse the simplicity of an SMA with a guarantee of results. It is worth recalling that no strategy guarantees a certain success. It is therefore recommended that you continually deepen your knowledge of technical analysis tools and follow your own investment rules to effectively manage risks.
MACD: The trend change identification tool
Let's move on to the third and final indicator discussed in this article. The MACD indicator, or Moving Average Convergence Divergence, is an essential technical tool for investors who want to understand trends. Developed by Gerald Call in the late 1970s, MACD is particularly appreciated for its ability to provide clear signals on trend reversals, making it a valuable ally for you to optimize your investment strategies.
MACD works by calculating the difference between two exponential moving averages (EMAs), often established over periods of 12 and 26 days. When a signal line, usually a 9-day EMA, crosses the MACD line, this may indicate a potential change in trend. For example, an upward crossing could signal a purchase opportunity, while a downward crossing could suggest a sales opportunity.
Whether for beginner or confirmed investors, understanding how MACD can be coupled with other indicators, such as the RSI, reinforces its relevance. The RSI measures the speed and change of price movements, and can complement MACD signals to further refine purchasing and sales decisions. By combining MACD with RSI, you can get a more nuanced perspective on market conditions, thus minimizing the risks you would take.
Quiz: What is the main role of the MACD indicator?
- It measures the speed and change in price movements.
- It determines the volume of daily transactions.
- It provides clear signals about trend reversals.
- It calculates the number of successful transactions.
Use and precautions
MACD is a powerful tool for discerning the momentum of a financial asset and detecting emerging trends. Crossing the MACD lines and its signal are useful indicators that can be interpreted to generate buying or selling alerts on the market.
However, as with the other two previous signals, it is crucial to note that volatile and unstable markets can lead to several false signals. This is why an informed investor never relies solely on MACD.
How to optimize your strategy with technical indicators
In conclusion, technical indicators such as the RSI (Relative Strength Index), the SMA (Simple Moving Average), and the MACD (Moving Average Convergence Divergence) are essential tools to refine your investment strategy. They can support your decisions by providing you with a clearer view of price dynamics and anticipating market fluctuations. But, to take full advantage of these tools, it is crucial to align them with your personal financial objectives and your investment horizon.
By learning how to use these different formulas judiciously and by setting your indicators correctly, you strengthen your ability to navigate successfully in financial markets. Indeed, the adoption of these good practices will allow you to optimize your investment decisions. With this knowledge, you will be better equipped to navigate in the often turbulent waters of the stock exchange and at the same time maximize your returns but also minimize your risks.

