How does our AI stock market analysis work?
Everyone knows, the stock market can't be predicted. This is logical, because the number of factors influencing markets is enormous, and even if one had the power to calculate them all, some variables would simply be impossible to obtain (for example, if a country makes an unexpected decision).
But does this mean that investing must be seen as a game of luck? Absolutely not. A large number of variables are available online, increasing the chances of profitable investment.
But, an estimate of the most likely situations? It's quite possible.
What's Zelyos?
 Zelyos, the tool you need to maximise your profits through AI stock market analysis.
Zelyos, it's just our attempt to put all your chances on your side. This project is based on artificial intelligence (just saying "on mathematics" didn't sound as good) to provide in-depth analysis on stock market shares, and is designed for private investors who therefore wish to make the best use of the available data, without needing to be an expert in finance.
To be more precise, we use artificial intelligence in several ways to analyze several aspects of a stock, such as the risk associated with the stock, or the forecasts of its future prices. Based on all these sub-analyses, our IA then gathers them together to provide an overall score associated with the stock. A high score indicates a high probability of growth in the future, while a low score indicates a high probability of decline in the future. As simple as that.
How does our IA assign the overall score?
You didn't think we were going to tell you everything, did you? We have to keep our recipe secret... but we're still going to try to be as transparent as possible, it's important after all.
So how does this famous Zelyos work? As I told you, we use IA to analyze stock markets to help you make decisions that are more informed. We collect and automatically analyze data from dozens of sources, thus removing the guess game from the market. It also avoids you having to juggle between 10 different tabs to get 10 different information. We're doing the dirty job for you kind of.
Our central model (that is, the one that centralizes the information of sub-models to produce the overall score) follows more than 60 indicators each day, over a multi-month analysis window, to produce market forecasts that are as reliable as possible. This avoids you having to ingest 60 multiplied by several months of data in order to make a decision, which is impossible for a human (in any case, not for me).
These indicators include closing stock market data, economic signals (such as inflation or unemployment), data on each company, and many other relevant factors. Behind the scenes, our sub-models rely on advanced time series analysis models (another term a little "fancy" but we found no simpler) and proprietary adjustments to refine the results.
Each stock gets a daily score between 0 and 10, where 10 indicates a stock with high growth potential, and 0 indicates the opposite. You can see this score on each stock page, as shown below. You will also find the variation of the overall score compared to yesterday (i.e. the number of points taken or lost since yesterday). You will also find a graph showing the other stocks with a similar overall score.
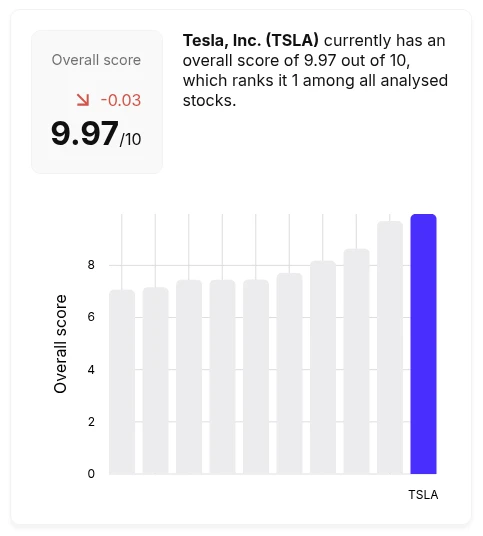 Overall score, which you can find on the stock pages.
But what are these "submodels"?
In short, sub-models are mini-AIs that analyze a specific aspect of the stock (its risk, future prices, etc.). They are briefly described in the following paragraphs.
Future price forecasts for the stock
This sub-model uses all the data at its disposal to produce a price forecast over the next 40 days (where the market is open, so about 2 months). It provides the most probable average prediction for each price. It is therefore quite possible that real prices may fluctuate around this average prediction.
On the chart, you can find in a light color the current prices, followed by the prediction of future prices in a darker color.
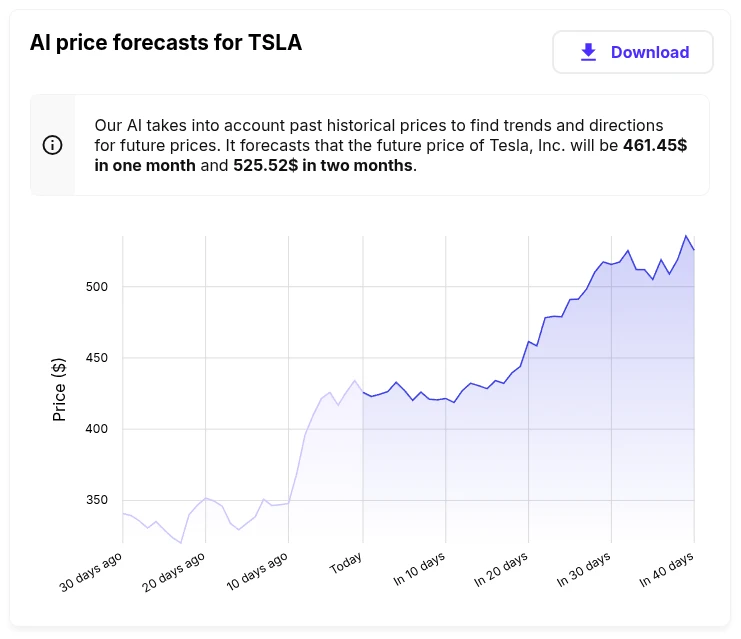 Example of prediction of future stock prices.
Risk analysis of the stock
Our risk analysis is based on what is known as the "beta", which corresponds approximately to the overall volatility of equity yields relative to market returns (S&P 500 for U.S. equities), as well as other factors to adjust risk. The risk provided by the AI is between 0 and 10, or 10 indicates a very risky stock and 0 indicates a low-risk stock.
On the chart, you will find the risk score based on the overall score. This allows you to choose stocks that are both low-risk and high-probability for growth.
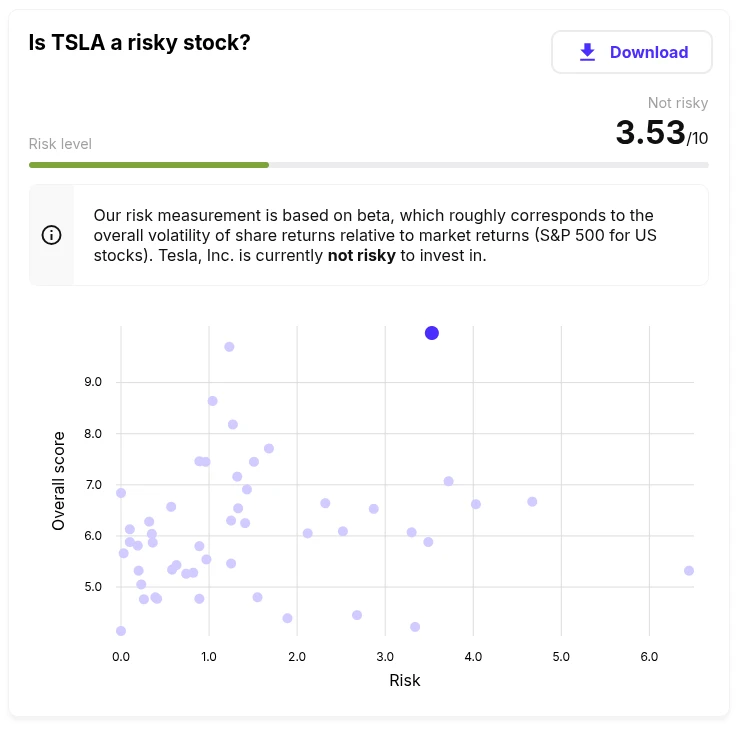 Example of a risk analysis for a stock.
Why use AI to invest in the stock market?
Let's be honest for two seconds: the stock market is complex. Following all the stocks on a daily basis? Almost impossible. That's when IA's stock market analysis tools like Zelyos make the difference.
As I told you earlier, Zelyos does most of the work for you. We will never make the decision for you, but we allow you to have the best information possible so that you can make the best decisions fairly quickly. To sum up, using this tool makes it possible to simplify investment by means of artificial intelligence analysis, based solely on data ("Men lie, but the data do not lie", so to speak), which are transparent and easy to understand. In short, Zelyos helps you to save time and make better decisions.
Maybe I'm not very convincing in writing these few lines, so what I'm proposing is to try it for yourself: zelyos.com.